
When the System Is Healthy but Users Are Waiting
What a three-year-old incident taught us about reading production signals
Three months ago we began receiving a familiar type of complaint: users were getting stuck on the login screen.
Requests were not failing. The system was not crashing.
But something was clearly wrong — actions that normally completed in a second were now taking 20–30 seconds.
The system wasn’t failing. It was slowing down.
The first concrete signal we had was response time.
Latency was increasing steadily across login requests.
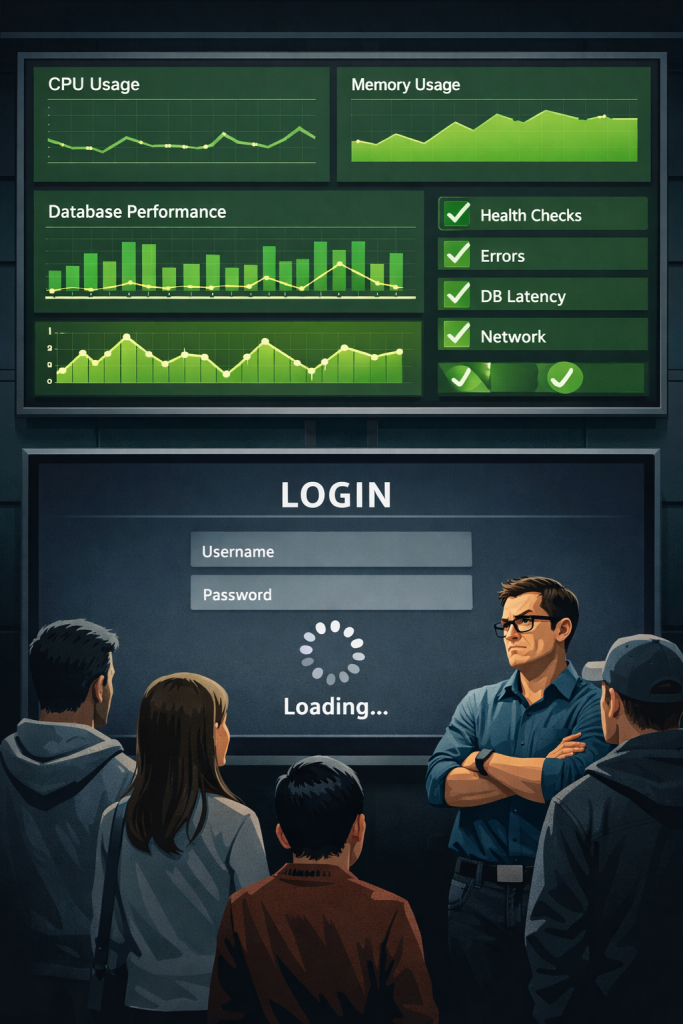
At first glance, everything else looked healthy.
CPU usage was normal.
Memory usage was stable.
Database latency was fine.
Error rates were near zero.
There were no alerts tied to availability — only latency.
And yet, users were waiting.
The situation felt strangely familiar.
Because three years earlier, we had experienced almost the same behavior, and back then it took us hours to understand what was happening. That earlier incident permanently changed how we investigate production problems.
This time, we didn’t start from scratch.
We started from memory.
The Incident From Three Years Ago
In the original incident, we followed a traditional investigation path:
Network → Load balancer → Database → Infrastructure.
All of them looked healthy.
The service responded to health checks. Machines were not overloaded. Database queries were fast. From an infrastructure perspective, the system was up.
But users could barely complete a login.
The confusion came from a simple assumption:
If the machines are healthy, the service must be healthy.
During that investigation, one metric behaved differently: the number of active worker threads inside the application process.
We noticed it, but we didn’t yet understand its significance. Increasing threads can correlate with increased traffic, and nothing else looked abnormal. So we kept searching external dependencies for a long time.
Only later did we capture a process dump and discover the real cause: requests were not failing — they were waiting.
That incident stayed with us.
Three Months Ago: A Different Investigation
When the recent incident began, we approached it differently.
We first validated the user experience using metrics.
Response time was steadily increasing across login requests.
However, database queries were completing within normal duration, and downstream service calls showed no degradation.
The requests were slow, but they were not waiting on a dependency.
That distinction was important.
If latency originates from a dependency, the delay appears in dependency metrics.
Here, the delay existed only at the request level.
So we looked at runtime behavior.
Active worker threads were steadily increasing while throughput remained flat.
The servers were accepting connections, yet they were not completing work proportionally. A healthy system processes more requests as concurrency rises. Ours was accumulating waiting work instead.
This was not a resource bottleneck.
It was a progress bottleneck.
At that moment, we decided to capture a memory dump.
Understanding the Latency
Latency was not spiking — it was gradually climbing over time.

Each minute, requests were completing slightly slower than the previous minute. This ruled out short-lived failures and pointed toward queueing behavior.
Requests were slow, yet they were not waiting on the database, another service, or the network.
They were waiting before execution.
At this point, the rising worker thread count became meaningful.
Requests were not slow because execution was expensive.
Requests were slow because execution was delayed.
What the Dump Showed
The dump confirmed the suspicion: requests were spending most of their lifetime waiting for available worker threads rather than executing business logic.

CPU usage remained low throughout the incident. The bottleneck was not computation time — it was scheduling time.
Under higher concurrency, a small number of blocking operations kept worker threads occupied longer than expected. As available threads decreased, new requests accumulated in the queue, increasing response times for all users.
The service was not resource-exhausted.
It was temporarily saturated inside the application runtime.
When Data Exists but Meaning Doesn’t
Our monitoring wasn’t blind.
The first abnormal signal we observed was latency. What was missing was a clear mapping between latency and a known failure mode.
The system returned successful responses. Health checks passed. Infrastructure metrics were healthy.
The data was accurate.
What we initially lacked was interpretation.
The application could accept connections and respond — just not within a useful time window.
Traditional monitoring asks:
“Are the servers alive?”
Users ask:
“Can I complete my action quickly?”
Those are not the same question.
What Changed After the First Incident
We didn’t add entirely new metrics.
We were already measuring latency.
What changed was how we interpreted it.
Previously, latency was treated as a performance concern. As long as requests succeeded and health checks passed, the system was considered available.
The earlier incident showed a gap in that thinking.
During the slowdown, the system produced correct responses, yet users could not complete actions in a reasonable time. From an infrastructure perspective the service was up. From a user perspective it was not.
So we reclassified latency.
It stopped being only a performance indicator.
It became an availability signal.
We began treating prolonged response times on critical operations as a service degradation, even when error rates remained low and machines were healthy.
Availability is not merely the existence of a response.
It is the usability of the system.
The Real Lesson
Incidents do not always start with alarms.
They often start with a signal that doesn’t match expectations. No crash. No failing health checks. Just a metric behaving differently.
Three years ago we had the data but didn’t recognize what it implied.
Three months ago we saw the same pattern and identified the issue within minutes.
The system had not become more observable.
We had become better at reading it.
Monitoring tells you what the system is doing.
Experience tells you what it means.
A system is healthy only when users can successfully and promptly do what they came to do.